Australia and Vietnam Economies: A Side-by-Side Table Comparison

Australia and Vietnam present a striking contrast across key indicators. Vietnam’s population is nearly four times larger, while Australia boasts a land area 23.5 times more expansive. Economically, Australia’s GDP is over four times greater, with higher GDP per capita. However, Vietnam shows greater income inequality and a heavier reliance on imports.

Basic Indicators

IndicatorAustralia Flag of Australia %28converted%29Vietnam Flag of VietnamComparison
Population source (2022 data), updated 202426.01 million (54th)98.19 million (15th)Vietnam’s population is approximately 3.78 times larger than Australia’s.
Surface area (sq. km) source (2022 data), updated 20247.74 million sq. km (6th)0.33 million sq. km (65th)Australia is 23.5 times larger than Vietnam.
GDP source (2022 data), updated 20241,692.96B USD (12th)408.80B USD (35th)Australia’s total GDP is approximately 4.14 times larger than Vietnam’s.
GDP per capita source (2022 data), updated 2024$65,100 (13th)4,164 USD (118th)Australia’s GDP per capita is roughly 85% higher than Vietnam’s, with Australians producing about $60,936 more per person annually.

Economic Indexes

IndexAustralia Flag of Australia %28converted%29Vietnam Flag of VietnamComparison
HDI (Human Development Index) source (2022 data), updated 20240.946 (10th)0.726 (101st)Australia’s HDI is 0.946 (very high), while Vietnam’s is 0.726 (medium). Australia’s score is 0.220 higher, indicating significantly better human development overall.
Index of Economic Freedom source (2024 data)76.2 (12th)62.8 (56th)Australia’s Index of Economic Freedom is 21.5% higher than Vietnam’s, 13.4 points more.
GINI source (2022 data), updated 202434.3 (2018 est.)36.8 (2020 est.)With a 7.3% higher Gini coefficient, Vietnam has a higher degree of income inequality than Australia.

International trade source(2023 data), updated 2024

IndicatorAustralia Flag of Australia %28converted%29Vietnam Flag of Vietnam
Total imports363.57B USD339.77B
Imports % of GDP19.71%91.74%
Main import partnersChina 28%, US 10%, South Korea 6%, Japan 6%, Singapore 5%China 38%, South Korea 17%, Japan 5%, Taiwan 4%, Thailand 4%
Main import itemsrefined petroleum, cars, garments, trucks, plastic productsintegrated circuits, broadcasting equipment, refined petroleum, telephones, fabric
Total exports447.51B USD374.27B
Exports % of GDP25.43%93.99%
Main export PartnersChina 29%, Japan 19%, South Korea 10%, India 7%, Taiwan 6%US 29%, China 15%, South Korea 6%, Japan 6%, Hong Kong 3%
Main export items
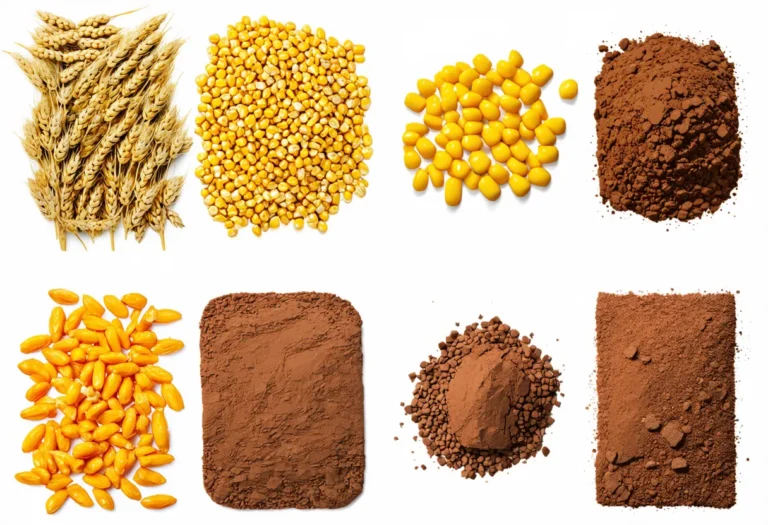
coal, iron ore, natural gas, gold, wheatbroadcasting equipment, garments, telephones, integrated circuits, machine parts

Australia imports slightly more than Vietnam, but Vietnam’s imports make up a whopping 91.74% of its GDP, compared to Australia’s 19.71%. Australia’s exports are 447.51B USD, focusing on raw materials, while Vietnam’s 374.27B USD exports are mainly tech and garments, making Vietnam’s exports vital to its economy.

Military Power source (2023 data), updated 2024

IndicatorAustralia Flag of Australia %28converted%29Vietnam Flag of Vietnam
Military expenditure32.3B USD6.3B USD
Military expenditure (% of GDP)1.90%2.3% (2018)
Active military59k482k
Active military per 1,000 capita3.85

Australia’s military expenditure is approximately 4.1 times larger than Vietnam’s at $32.34 billion compared to $6.3 billion, while Vietnam allocates a higher percentage of its GDP to defense at 2.3% compared to Australia’s 1.9%.

Share These Resources:

Comments

Leave a Reply

Your email address will not be published. Required fields are marked *